Public paper · October 2, 2026 · long read
Census: August Manufactured Goods Orders Up 0.1% to $663.5 Billion
Census M3 for August 2026: new orders +0.1% to $663.5B (second month up), shipments flat, unfilled orders and inventories still rising. Plain English from the official release.
noticenearby.com/papers/august-2026-manufactured-goods-orders-census-m3.pdf
Friday’s manufacturers’ tape is out. The U.S. Census Bureau’s full Monthly report on Manufacturers’ Shipments, Inventories, and Orders — the M3 — covers August 2026. It is not a market call and not a forecast. It is the public factory-orders book.
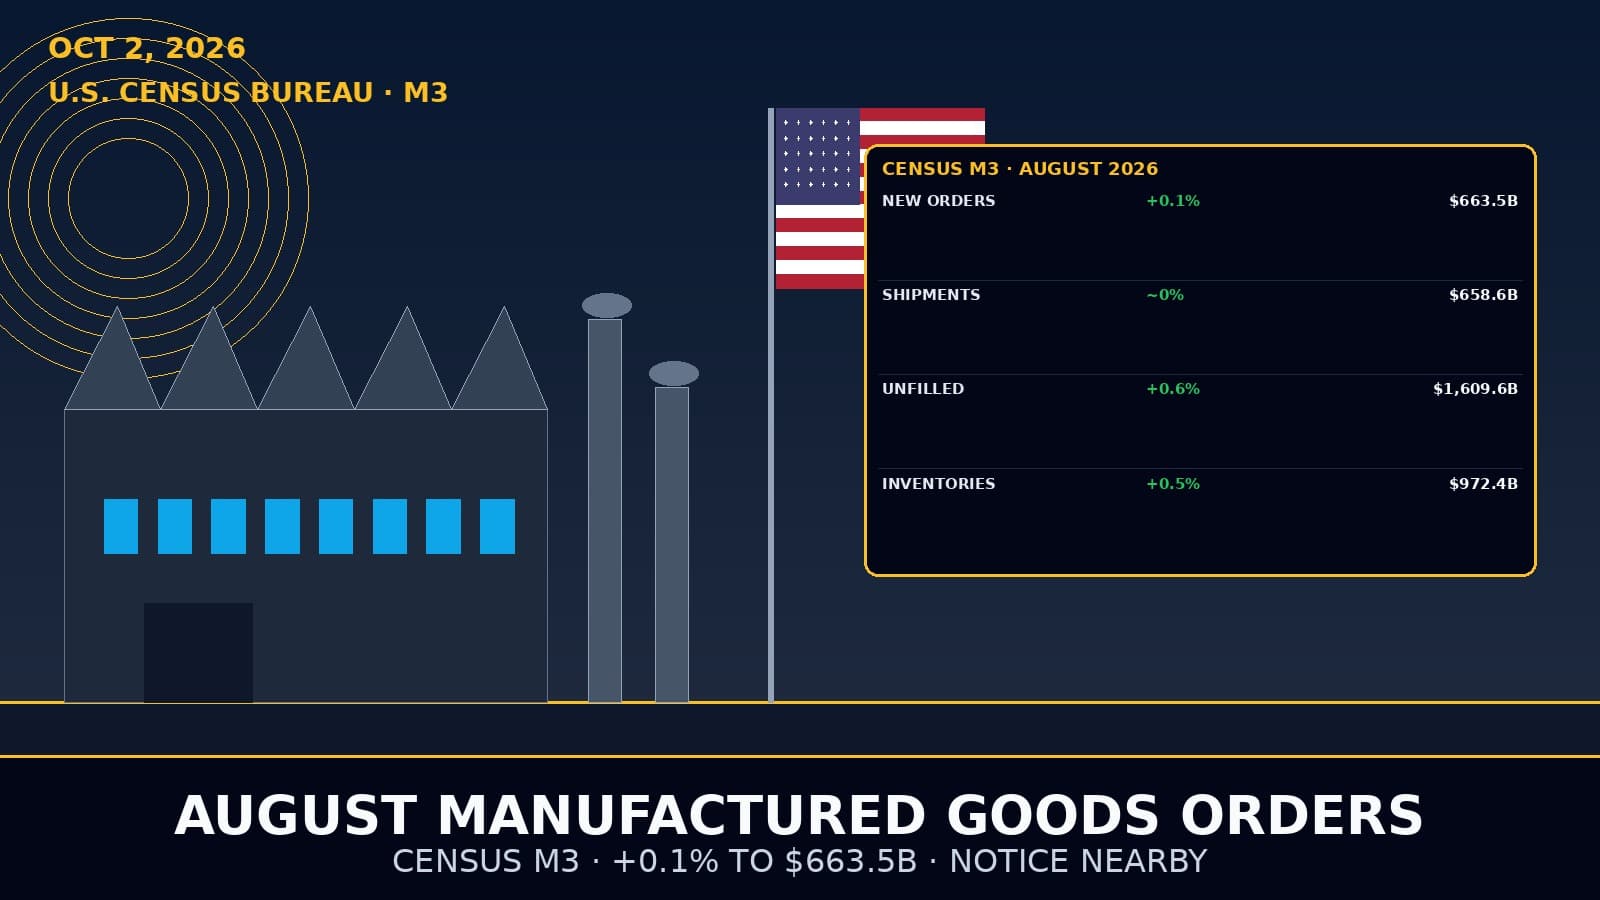
For Immediate Release on Friday, October 2, 2026, Census said new orders for manufactured goods rose for a second straight month. Orders increased $0.7 billion, or 0.1 percent, to $663.5 billion. That followed a 0.8 percent July increase.
Notice Nearby’s job is the public record. This brief restates the headline M3 levels and month-to-month moves — orders, shipments, unfilled orders, and inventories — in civic English so neighbors, reporters, and local officials can see what Census actually published.
The short version
Four headline series sit at the center of the M3:
- New orders — what factories booked in the month
- Shipments — what left the plant
- Unfilled orders — the backlog still on the books
- Inventories — stock on hand
In August, orders edged up. Shipments were virtually unchanged. The backlog and inventories both rose again. Ratios moved only a little: the unfilled-orders-to-shipments ratio rose to 6.87 from 6.81, and the inventories-to-shipments ratio rose to 1.48 from 1.47.
New orders — second consecutive monthly rise
New orders for manufactured goods in August increased $0.7 billion or 0.1 percent to $663.5 billion. Census notes that was the second consecutive monthly increase, following a 0.8 percent rise in July.
A 0.1 percent move on a $663.5 billion book is a small seasonally adjusted step. The public point is direction and streak: orders are up two months in a row after July’s larger print, not that August alone rewrote the factory story.
Shipments — virtually unchanged after eight monthly gains
Shipments decreased less than $0.1 billion, or were virtually unchanged, at $658.6 billion. That ended a run of eight consecutive monthly increases. July shipments had risen 0.8 percent.
Orders at $663.5 billion and shipments at $658.6 billion left a small gap that feeds the unfilled-orders story below. Census’s own wording — “virtually unchanged” — is the right label for August shipments, not a claim of a sharp drop.
Unfilled orders — up in 25 of the last 26 months
Unfilled orders increased $9.9 billion or 0.6 percent to $1,609.6 billion. Census says that was the twenty-fifth increase in the last twenty-six months. July’s unfilled-orders gain was also 0.6 percent.
The unfilled orders-to-shipments ratio was 6.87, up from 6.81 in July. In plain terms, the backlog is still climbing relative to what plants are shipping each month. That ratio is a stock-to-flow measure: how many months of current shipments the backlog would represent if nothing else changed. It is not a delivery-date promise for any one industry.
Inventories — eleventh consecutive monthly rise
Inventories increased $5.1 billion or 0.5 percent to $972.4 billion. That was the eleventh consecutive monthly increase. July inventories had risen 0.4 percent.
The inventories-to-shipments ratio was 1.48, up from 1.47 in July. Factories added stock a bit faster than the flat August shipments pace. As with the unfilled ratio, the I/S figure is a Census published relationship — not a judgment that inventories are “too high” or “too low.”
How to read the August print
Orders up two months, shipments flat after a long climb, backlog and inventories still rising — that is the August M3 shape in one sentence. July’s 0.8 percent order and shipment gains were larger month-to-month moves; August’s 0.1 percent order rise and flat shipments are quieter.
Readers who only watch new orders miss the backlog and inventory columns. Unfilled orders at $1.61 trillion and inventories at $972.4 billion are large stocks. Small percentage moves still add billions of dollars to those levels, which is why Census reports both the dollar change and the percent change.
What this brief is — and is not
This is a Notice Nearby public paper: Ryan Standley / Record of Sale, LLC / Notice Nearby. It restates the U.S. Census Bureau’s Monthly Full Report on Manufacturers’ Shipments, Inventories, and Orders for August 2026. Figures above are the seasonally adjusted headline values Census published on October 2, 2026.
It is not Federal Reserve policy advice, not a market call, and not Legal Publication. It does not invent industry splits, durable-versus-nondurable detail beyond the release headlines used here, or forecasts for September. Markets may price factory orders one way and inflation another; that pricing is not in the M3 tables.
Where to verify
Primary source: U.S. Census Bureau, Monthly Full Report on Manufacturers’ Shipments, Inventories, & Orders, For Immediate Release Friday, October 2, 2026. Current release page: https://www.census.gov/manufacturing/m3/current/index.html
Data inquiries: Economic Indicators Division, Shipments, Inventories, and Orders Branch (M3), 301-763-4832, eid.m3.qs@census.gov. Media: Public Information Office, 301-763-3030, pio@census.gov. Tables 1–8 are published with the release in PDF and Excel on the same Census M3 page.
Spark context for this brief: the Census Bureau’s public post summarizing the August new-orders headline (https://x.com/uscensusbureau/status/2106026474033557759). Always verify against the official release page and tables.
Notes and sources
- Source: U.S. Census Bureau, Monthly Full Report on Manufacturers’ Shipments, Inventories, & Orders (M3), For Immediate Release Friday, October 2, 2026. https://www.census.gov/manufacturing/m3/current/index.html
- Figures are seasonally adjusted Census published headline values only. No invented industry splits or market forecasts.
- Charts (Blob): https://hihs6w0svedgboc5.public.blob.vercel-storage.com/notice-nearby/papers/august-2026-manufactured-goods-orders-census-m3/chart-aug-levels.jpg · https://hihs6w0svedgboc5.public.blob.vercel-storage.com/notice-nearby/papers/august-2026-manufactured-goods-orders-census-m3/chart-mom-pct.jpg · https://hihs6w0svedgboc5.public.blob.vercel-storage.com/notice-nearby/papers/august-2026-manufactured-goods-orders-census-m3/chart-ratios.jpg
- Author: Ryan Standley / Record of Sale, LLC / Notice Nearby.
- Discussed on @NoticeNearYou: (pending — fill xPostUrl after live post).
- Not legal advice. Not a newspaper. Not Legal Publication. Record of Sale, LLC (Oregon).
Public papers shelf · Census M3 August 2026. Charts: levels https://hihs6w0svedgboc5.public.blob.vercel-storage.com/notice-nearby/papers/august-2026-manufactured-goods-orders-census-m3/chart-aug-levels.jpg · MoM % https://hihs6w0svedgboc5.public.blob.vercel-storage.com/notice-nearby/papers/august-2026-manufactured-goods-orders-census-m3/chart-mom-pct.jpg · ratios https://hihs6w0svedgboc5.public.blob.vercel-storage.com/notice-nearby/papers/august-2026-manufactured-goods-orders-census-m3/chart-ratios.jpg. Spark: https://x.com/uscensusbureau/status/2106026474033557759. @NoticeNearYou post pending.
Not legal advice. Not a newspaper. Not Legal Publication. Record of Sale, LLC (Oregon).